Breaking Down the Octant Epoch 7 Climate Solutions Funding Round
Trinity Morphy provides his analysis of the recent round by Octant and Climate Coordination Network.
By Trinity Morphy | June 6th, 2025

Octant, a community platform from the Golem Foundation, uses money from staked Ethereum (ETH) to fund public good projects. Every 90 days (an "epoch"), some of these ETH rewards go into a grant pool to fund public goods. Octant users who lock their GLM tokens earn ETH rewards and can either keep them or donate them to selected projects when the epoch round goes live. So far, Octant has given out about $6 million in grants to over 65 projects in its first six funding rounds.
Epoch 7 was different because it focused only on climate solutions. Furthermore, earlier epochs funded any public good project the community voted in, but Epoch 7 was specifically for climate projects chosen by the Climate Coordination Network (CCN). Only projects directly tackling climate change were eligible, fitting into specific areas like climate data, nature restoration, or clean energy. At the end of the round, 20 projects collectively shared in a 298.6665 ETH ($542,106.58) allocation from Octant. The following is my analysis of the round.
Note: The USD price of $1,815.09 used to calculate for ETH is based on the closing price of ETH on April 25th, the day Octant officially announced the end of the round and the distribution of funding.
Key findings
-
Donor count ≠ Funding amount - Projects like Blue Filter Company received the 2nd-highest funding despite being 6th in donor count, showing that fewer donors with higher stakes can dramatically influence outcomes.
-
Web3 nativeness wasn’t rewarded - Non-Web3-native projects received $5,000 more on average than Web3-native ones, defying expectations that crypto-native donors would favour crypto-native projects.
-
Global > Local - Global projects had more funding ($29,962.80) and donors (117) than local ones (funding = $24,767.43, donors = 108), suggesting donors may have favoured scale and perceived reach.
-
Revenue-generating ≠ better funding - Projects without revenue potential received ~$12,500 more on average than those with one, showing a donor preference for “pure” public goods.
-
Water-based solutions stood out - Among projects with revenue potential and time to impact, Water-based Solutions received the highest average funding, suggesting that some themes were more innovative and intriguing to fund even if they were commercialized or took years to achieve impact.
-
Web3-native + revenue = worst combo - Web3-native projects with revenue potential received the lowest average funding ($13,942.12), reflecting deep scepticism of their tech stack and business model.
-
Short-term impact wins - Projects with a short time to impact got $9,000 more on average, highlighting a bias toward immediacy over systemic change.
-
Global + short-term = strongest combo - Global solutions with a short time to impact had the highest average funding ($40,767.53), showing a clear donor preference for broad, fast-impact solutions.
Projects
The round featured the following 20 projects classified as follows:
-
Category - The project's area of focus
-
Web3 - Whether the project uses Web3 solutions as part of its core infrastructure or not
-
Revenue - Whether the project has or is testing a realistic business model or has no plans for revenue
-
Scope - Whether the project is global or local in scope
-
Time - Whether the project has a long or short impact horizon
| Project | Category | Web3 | Revenue | Scope | Time |
|---|---|---|---|---|---|
| Astral Protocol | Technology infrastructure | Yes | No | Global | Long |
| Atlantis | Technology infrastructure | Yes | No | Global | Short |
| Bees and Trees Uganda | Land-based regeneration | No | Yes | Local | Long |
| Bioverse | Land-based regeneration | No | Yes | Local | Long |
| Bloom Network | Communal coordination | No | No | Global | Short |
| BlueFilter Company | Water-based solutions | No | Yes | Local | Short |
| Change Code | Technology infrastructure | Yes | Yes | Global | Long |
| DeFood | Agriculture and food systems | Yes | No | Local | Short |
| Ekonavi | Agriculture and food systems | Yes | Yes | Local | Short |
| eSusFarm | Agriculture and food systems | Yes | Yes | Local | Short |
| GainForest.Earth | Land-based regeneration | Yes | No | Global | Long |
| GEN Ukraine | Communal coordination | No | No | Local | Short |
| Gili Eco Trust | Water-based solutions | No | No | Local | Long |
| M3tering | Energy infrastructure | Yes | Yes | Local | Long |
| Oceanus Group | Water-based solutions | No | No | Global | Long |
| Open Collective | Technology infrastructure | No | Yes | Global | Short |
| Regenerate Barichara | Land-based regeneration | No | No | Local | Long |
| Rifai Sicilia | Communal coordination | Yes | Yes | Local | Long |
| Silvi | Land-based regeneration | Yes | Yes | Global | Long |
| Seabrick | Water-based solutions | No | Yes | Global | Local |
General analysis
With those classifications in mind, I conducted the following analysis:
Donors and funding by project
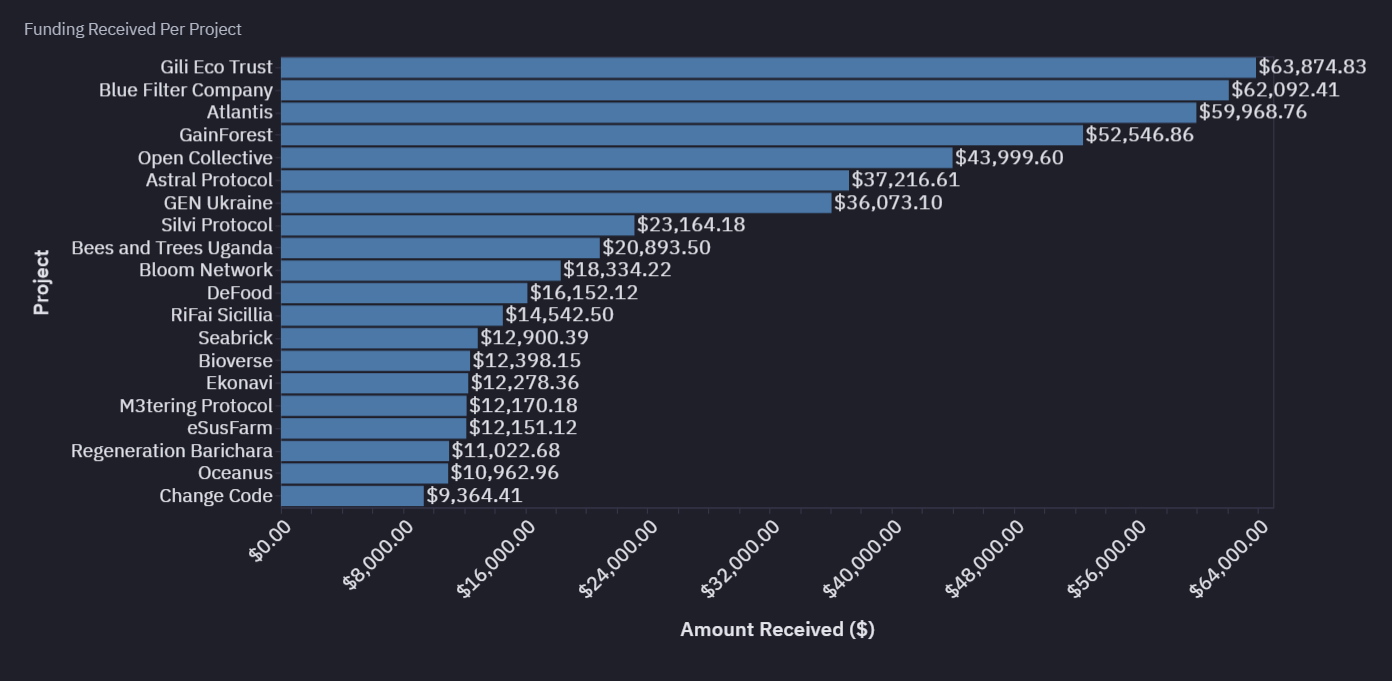
Figure 1.1 - Funding by Project
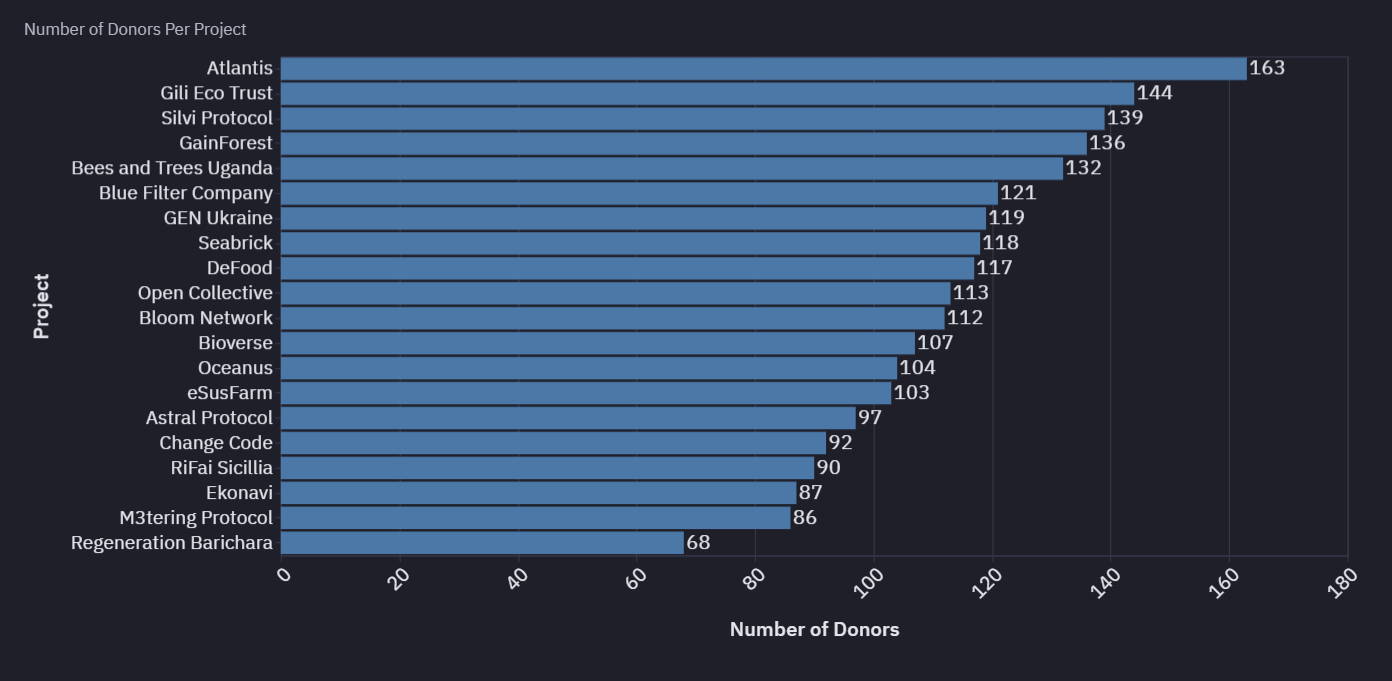
Figure 1.2 - Contributions by Project
Figures 1.1 and 1.2 reveal that a higher number of donors did not always translate to higher funding. In Figure 1.2, Atlantis (163), Gili Eco Trust (144), Silvi Protocol (139), GainForest (136), and Bees & Trees Uganda (132) secured the top five spots for the number of donors. However, when compared to Figure 1.1, which shows funding amounts, we see something different.
Blue Filter Company, which ranked 6th in donor count, received the second-highest funding ($62,092.41), surpassing several projects with more donors. Notably, Bees & Trees Uganda, despite ranking 5th in donor count, only ranked 9th in funding received ($20,893.50)—a gap of over $40,000 compared to Blue Filter. Similarly, Silvi Protocol ranked 3rd in donor count but only 8th in funding ($23,164.18). In contrast, Atlantis ($59,968.76), GainForest ($52,546.86), and Gili Eco Trust ($63,874.83) remained in the top five for both donor count and funding received.
My assumption is that this discrepancy could be attributed to the unequal distribution of staking rewards from GLM token locking among donors. Donors to Bees & Trees Uganda may have received relatively small staking rewards due to locking fewer tokens and may have wanted to spread their funding impact across multiple projects, leading to smaller donations. In contrast, donors to Blue Filter Company were likely individuals who locked large amounts of GLM and received substantial staking rewards, which they may have donated partially or entirely to Blue Filter. This could have skewed the matching mechanism in Blue Filter’s favor.
Donors and funding by category
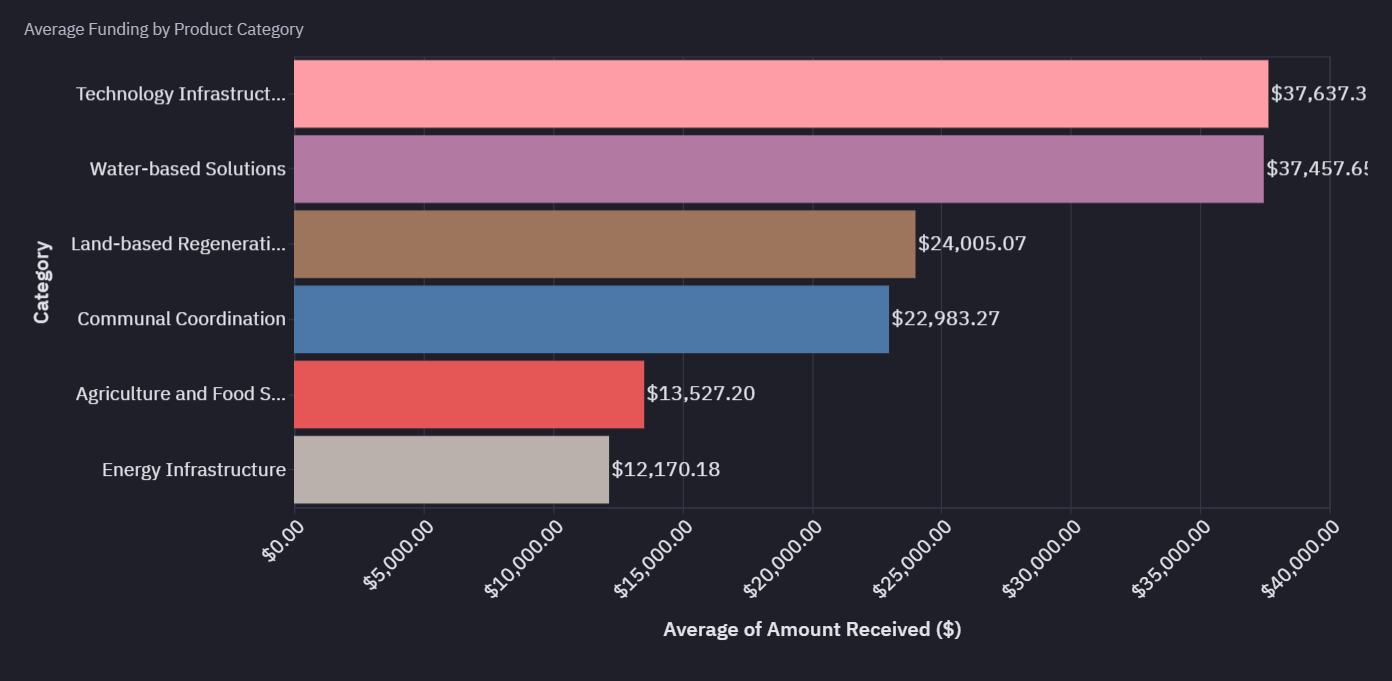
Figure 1.3 - Averaging Funding by Category
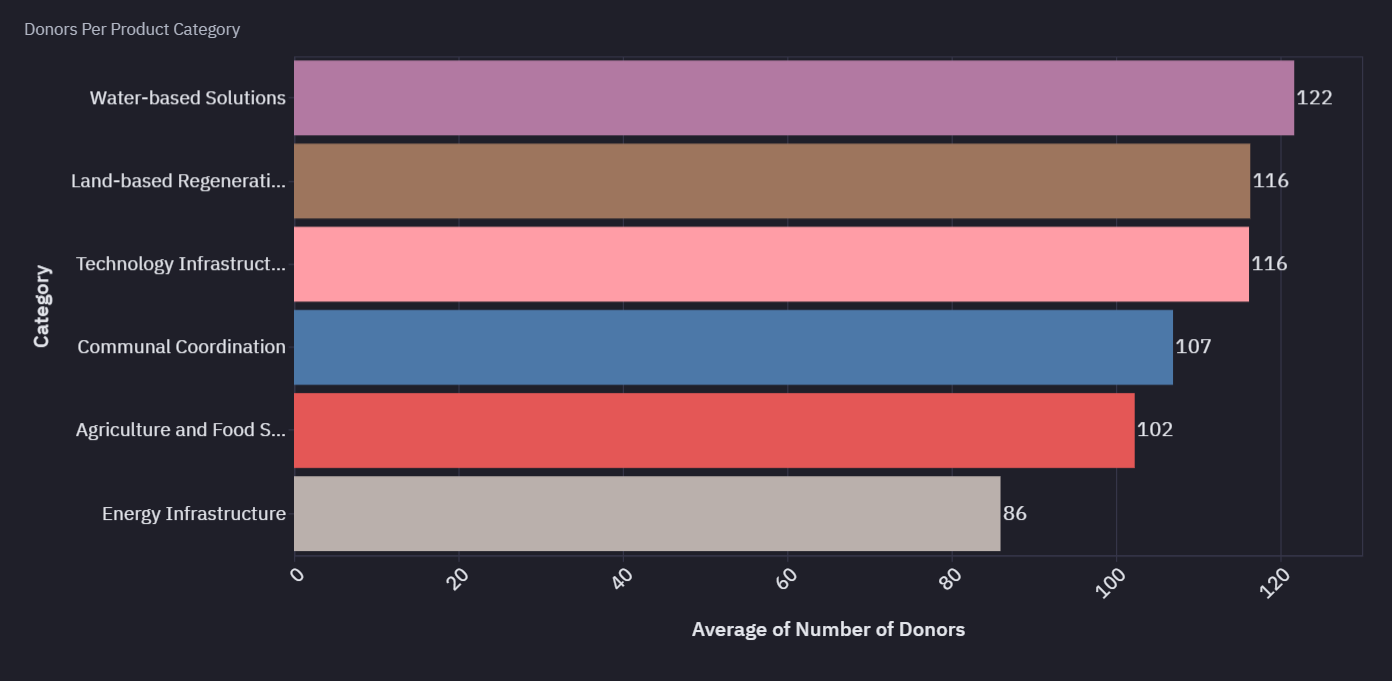
Figure 1.4 - Average Number of Donors by Project Category
From Fig 1.3, Technology Infrastructure received the highest funding ($37,637.34) followed by Water-based Solutions ($37,457.65). Land-based Regeneration projects averaged $24,005.07 and Communal Coordination projects received $22,983.27 and. However, Agriculture and Food Systems received relatively low funding, averaging $13,781.03. The lowest funded category was Energy Infrastructure, with an average of just $12,535.29.
From Fig 1.4, Although the donor numbers almost align with the average funding received, we can see that Water-based Solutions with the highest number of donors (122) received the second highest funding ($37,457.65).
Donors and funding by Web3
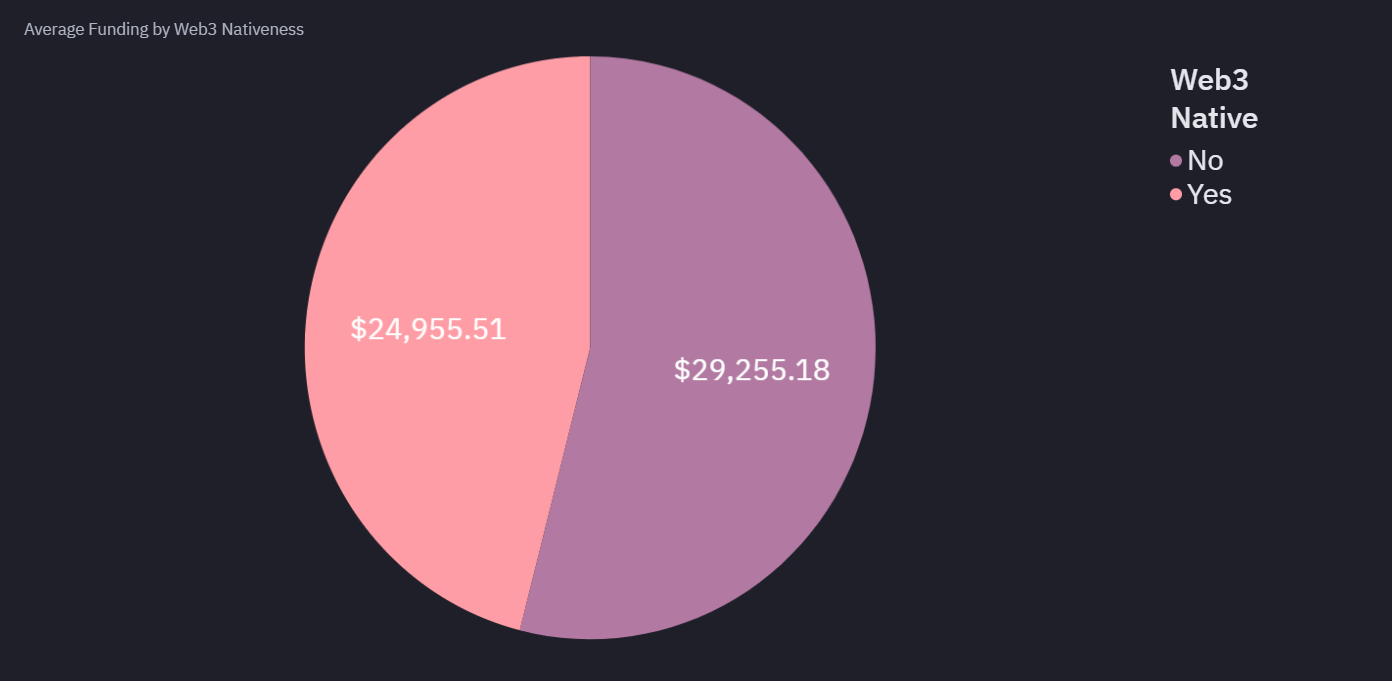
Figure 1.5 - Averaging Funding by Web3
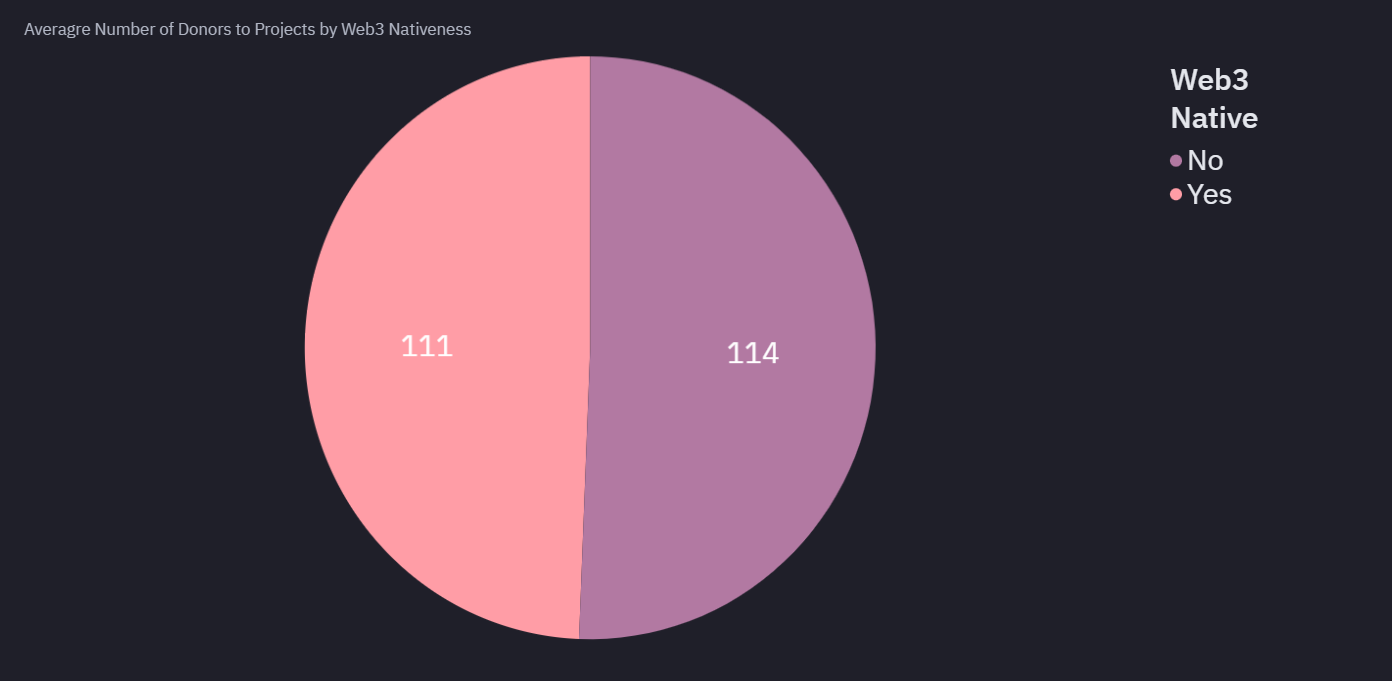
Figure 1.6 - Average Number of Donors by Web3
This round included a notable number of non-Web3-native projects, which initially led me to expect a funding bias in favor of Web3-native initiatives. However, the data suggests otherwise. Non-Web3-native projects received more funding on average—$29,255.18 from 114 donors—compared to Web3-native projects, which averaged $24,955.51 from 111 donors. Despite the minimal difference in donor count, non-Web3-native projects received approximately $5,000 more per project.
This indicates that being Web3-native did not guarantee higher funding. In fact, it may have been a disadvantage. Many donors, likely crypto-natives, had the domain expertise to critically evaluate Web3-native projects. When the real-world impact of these projects wasn’t immediately clear, this deeper scrutiny may have led to more conservative funding decisions. In contrast, non-Web3-native projects may have benefited from emotionally resonant storytelling that appealed to donors, making it easier to attract support without requiring technical validation.
Donors and funding by scope
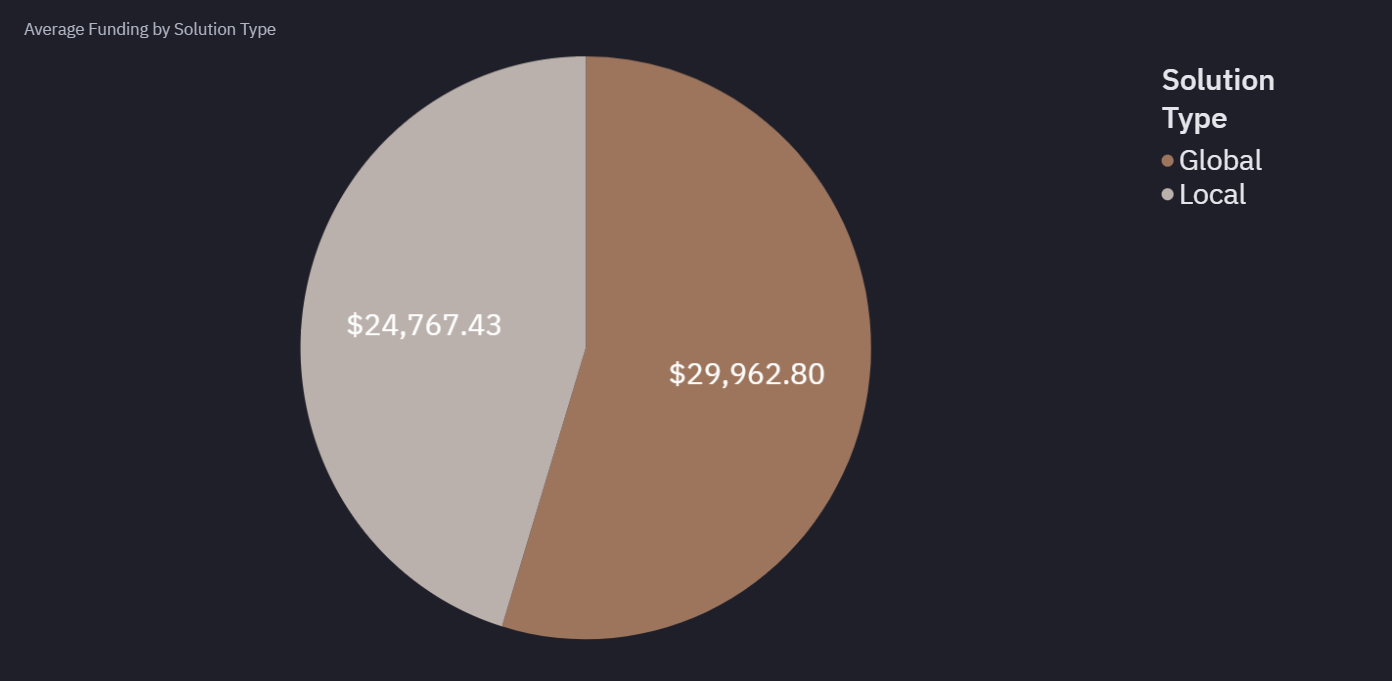
Figure 1.7 - Averaging Funding by Scope
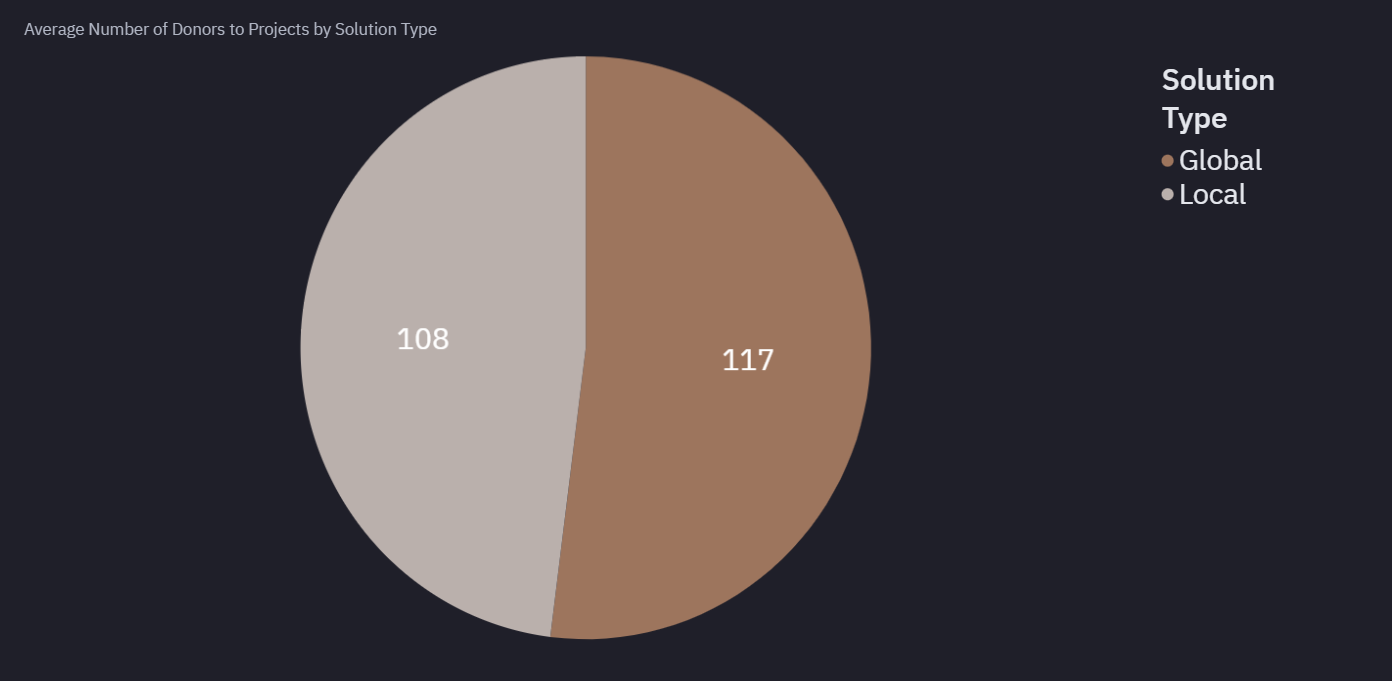
Figure 1.8 - Average Number of Donors by Scope
117 donors in the round contributed a higher funding amount of $29,962.80 to global projects, while 108 supported local solutions with a lower average of $24,767.43. Despite having 9 more donors, local solutions received approximately $5,000 less per project than global ones. This suggests that global projects received higher donations per donor compared to local solutions.
Donors and funding by revenue
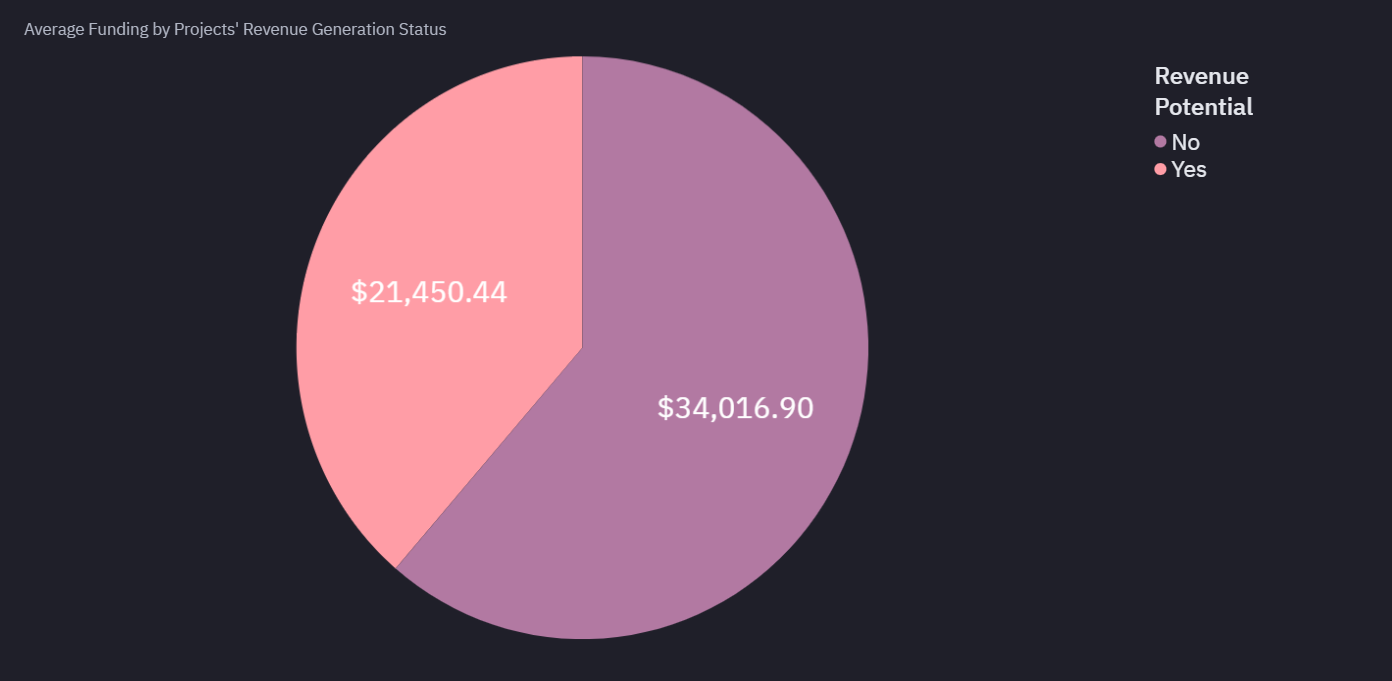
Figure 1.9 - Averaging Funding by Revenue
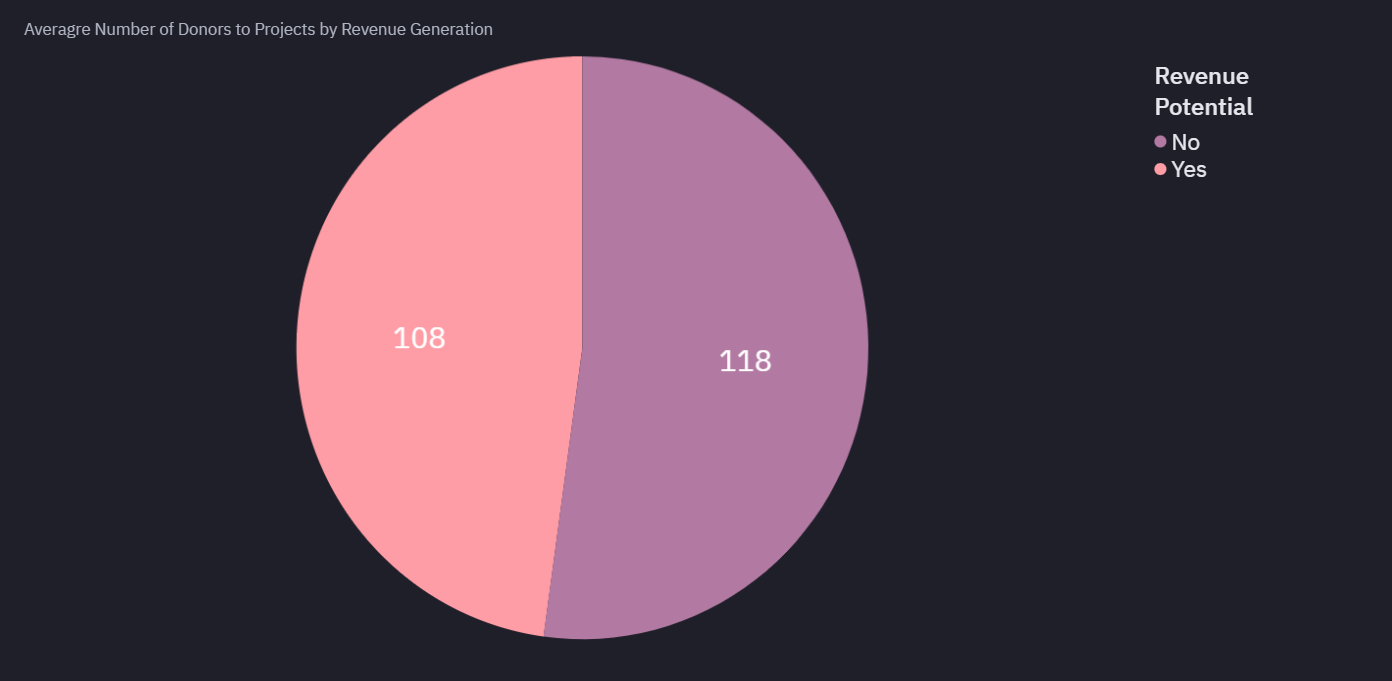
Figure 1.10 - Average Number of Donors by Revenue
118 donors contributed a higher funding amount of $34,016.90 to projects without revenue-generating potential, while 108 donors supported revenue-generating projects with a lower average of $21,450.44.
This finding is troubling, as anyone with a reasonable understanding of the climate and sustainability space knows that achieving a balance between impact and long-term sustainability is a persistent challenge. The inclusion of revenue-generating projects in the round suggests that the Climate Coordination Network thoroughly vetted them to ensure they were not compromising impact for profit. Yet, donor preferences leaned toward projects without revenue potential, projects that are fully dependent on grants to survive. If these projects fail to secure continued funding, they risk shutting down once their existing treasuries are depleted.
Meanwhile, projects that have the potential to become self-sustaining through revenue once they gain traction received significantly less funding that could have been crucial in helping them reach that sustainable stage.
Donors and funding by time
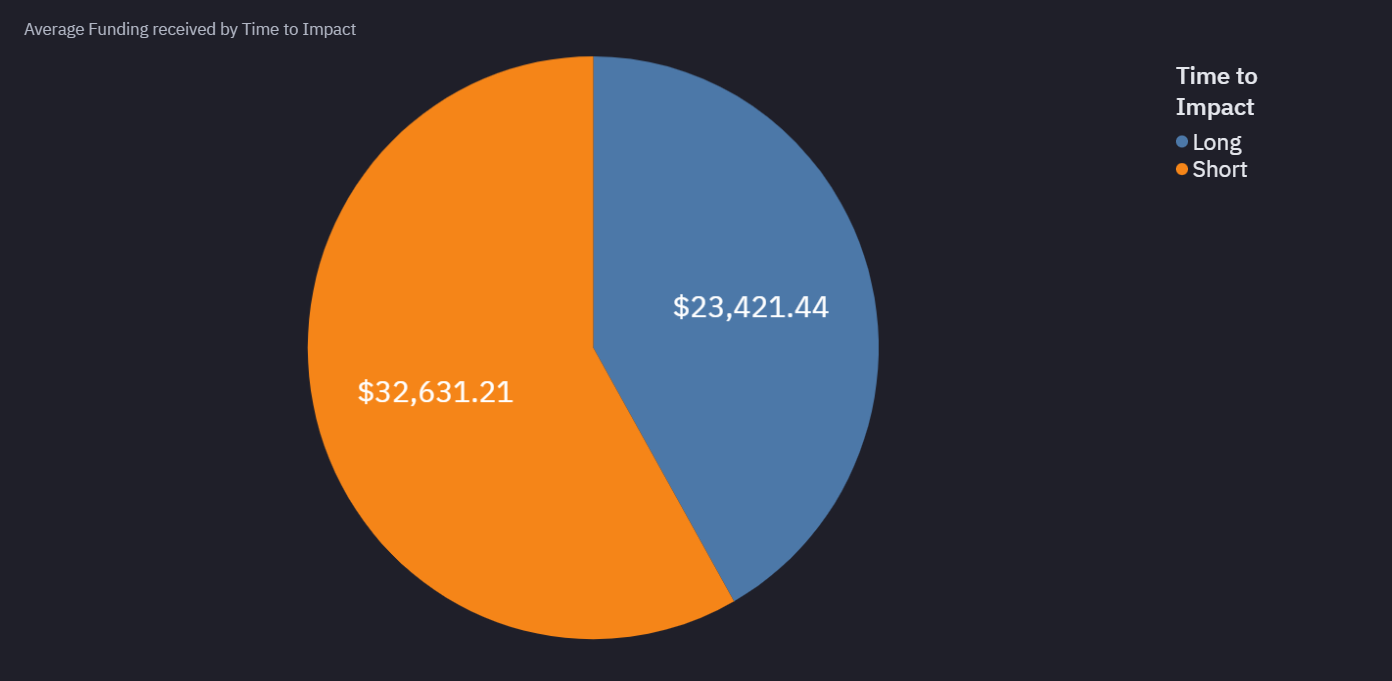
Figure 1.11 - Averaging Funding by Time
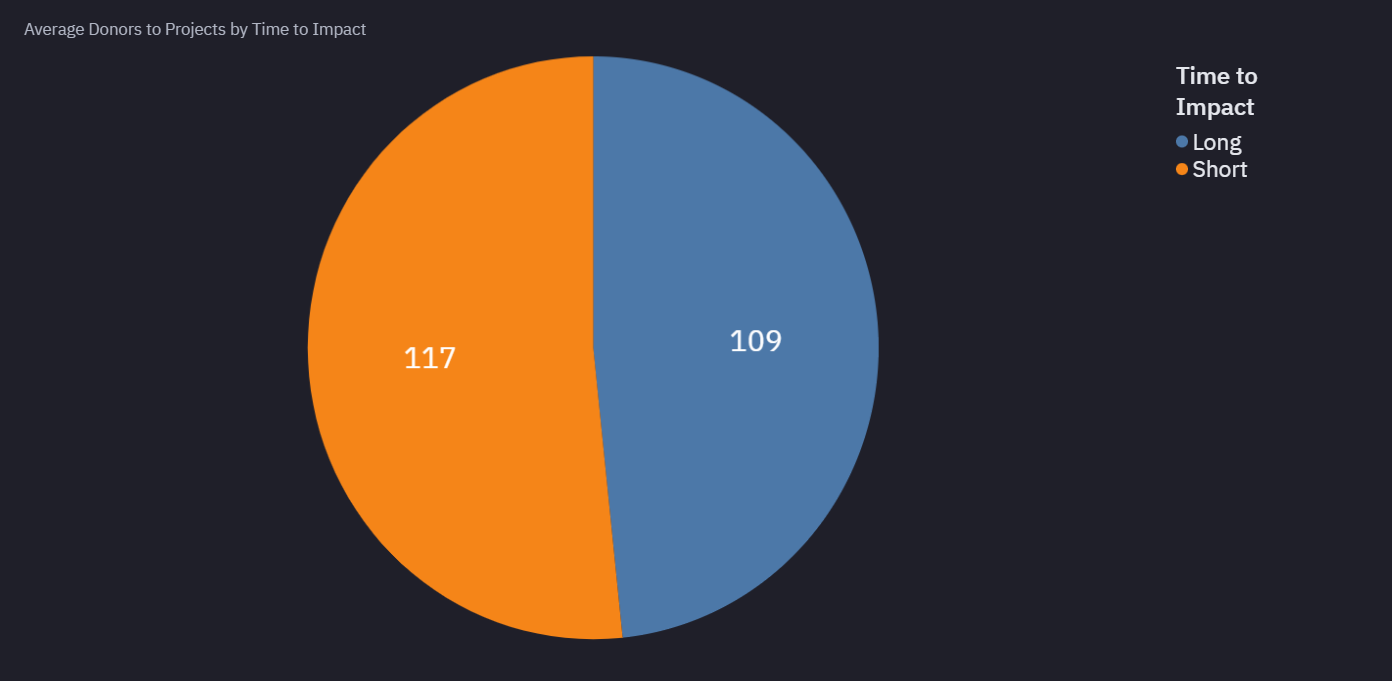
Figure 1.12 - Average Number of Donors by Time
By combining Figures 1.11 and 1.12, we observe that projects with a shorter time to impact received an average of $32,623.21 from 117 donors, while those with a longer time to impact received a lower average of $23,421.44 from 109 donors; a funding gap of approximately $9,000. This outcome is understandable. Projects with a longer time to impact often require sustained resources to first raise awareness about the problem, then develop the systems needed to address it, and finally drive adoption of those systems to achieve meaningful impact. In contrast, projects with a shorter time to impact typically leverage existing infrastructure to tackle problems that are already well understood and relatable to the public, making their impact immediately achievable.
Donors by revenue and time
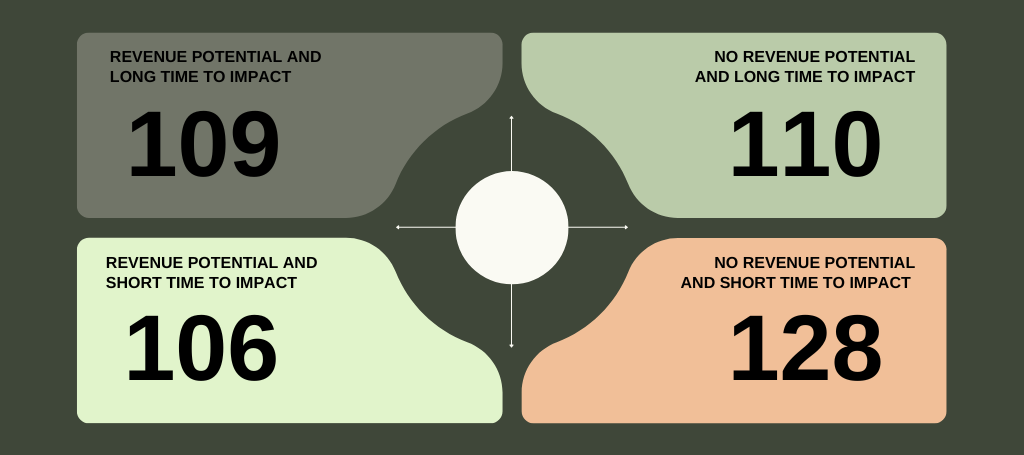
Figure 1.13 - Donor Count by Revenue and Time
-
109 donors supported projects with revenue potential and a long time to impact. These projects are likely to face significant challenges in both achieving profitability and delivering measurable impact. They are typically addressing lesser-known problems that the public may not yet recognise as urgent, making adoption and traction difficult.
-
106 donors supported projects with revenue potential and a short time to impact. These are likely to succeed both financially and in terms of impact. They target well-known climate issues and pair them with direct revenue models that can sustain operations. Once they gain market traction, their growth is likely to be steady and self-sustaining.
-
110 donors supported projects with no revenue potential and a long time to impact. These projects are the most at risk. Because their impact takes time to materialise and they lack a sustainable funding model, they may struggle to meet the reporting requirements of most grant programs, which often demand results.
-
128 donors supported projects with no revenue potential and a short time to impact. These are more likely to be around in the next 5–10 years. Their quick impact timelines make them attractive to grant funders, as they can demonstrate results more quickly. In fact, this could explain why they attracted the highest number of donors in the round.
Patterns based on revenue
The following analysis explains the results according to the revenue classification.
Funding split by revenue

Figure 2.1 - Average Funding by Revenue
Although the Epoch 7 application form included several questions about revenue generation and financial models, the actual funding outcomes suggest that the community placed less emphasis on this factor. On average, projects with no revenue potential received significantly more funding ($34,016.90) compared to projects with revenue potential ($21,450.44), with a ~$12,500 funding difference.
This indicates that projects with revenue potential were likely evaluated more, with donors considering the feasibility of their business models and the possibility of revenue goals compromising impact. Whereas projects with no revenue potential were immediately seen as public goods and resonated more, attracting a greater donor count than its counterpart.
Funding split by revenue and category
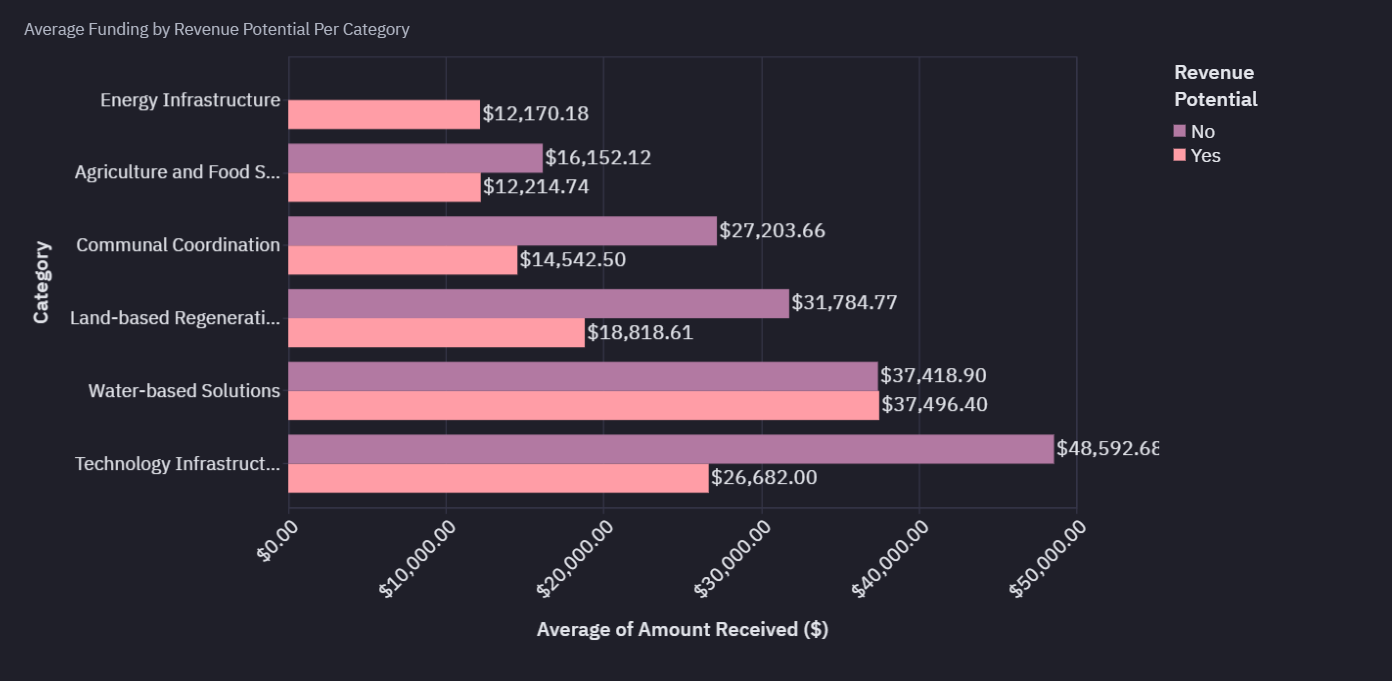
Figure 2.2 - Funding Split by Revenue and Category
Water-based solutions stood out as the category that received the highest funding among projects with revenue potential, averaging $37,496.40, while Energy Infrastructure received the least at $12,170.18, which is understandable given that only one project was accepted in that category. Among projects with no revenue potential, Technology Infrastructure topped the list with an average funding of $48,592.68, whereas Agricultural and Food Systems received the lowest average funding at $16,152.12.
Funding quadrant by revenue and scope
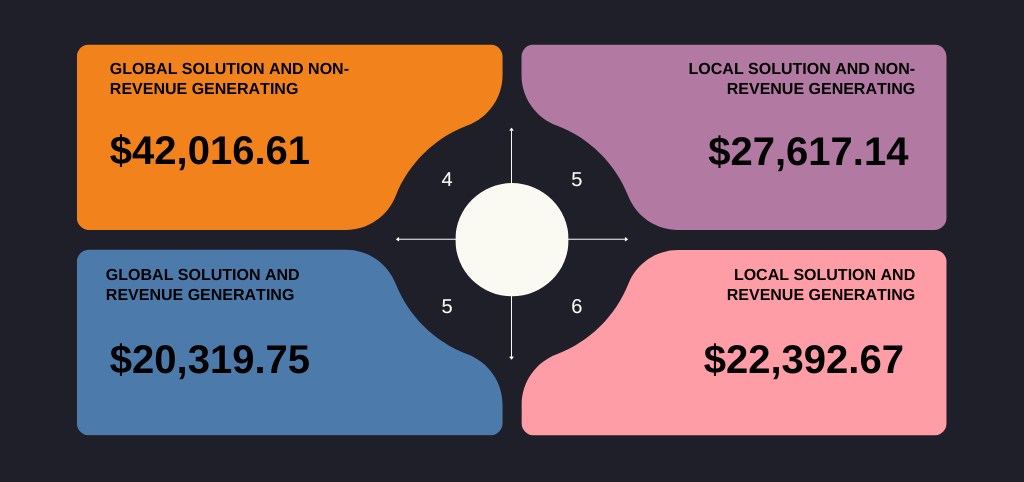
Figure 2.3 - Funding Quadrant by Revenue and Scope
-
Global solutions with no revenue potential received the highest funding. Although this quadrant had the fewest projects (4) in the round, they received the most funding ($42,016.61). This was possible because these projects presented as the best form of climate public goods – solving the climate problem on a wider scale with no cost whatsoever to beneficiaries/users.
-
Global solutions with revenue potential received the lowest funding. They likely received less funding because, despite their global scale, their commercial models didn’t directly address the climate problem. Instead, they focused on enabling or supporting other solutions to tackle the issue first.
Funding quadrant by revenue and Web3
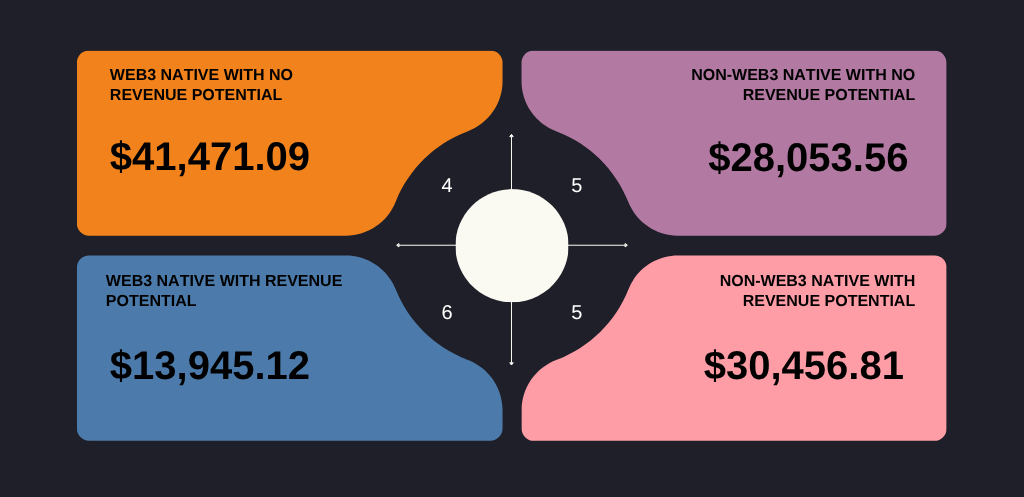
Figure 2.4 - Funding Quadrant by Revenue and Web3
-
Web3 native projects with no revenue potential received the highest funding. Although this quadrant had the fewest projects (4) in the round, they received the most funding ($41,471.09). This was possible because these projects presented as the best form of climate public goods.
-
Web3 native projects with revenue potential received the lowest funding. Despite having the highest number of projects in the round (6), this category received an average of only $13,942.12—nearly $15,000 less than the next highest-funded category. It's likely that broader skepticism toward ReFi projects, particularly due to their repeated struggles to establish sustainable revenue models, played a significant role in the lower funding these projects received.
Funding quadrant by revenue and time
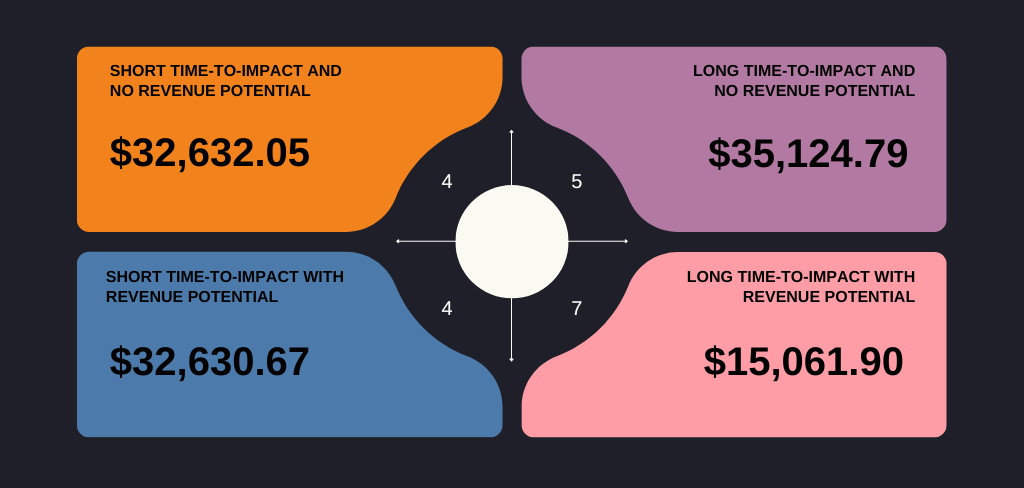
Figure 2.5 - Funding Quadrant by Revenue and Time
-
Long time-to-impact projects with no revenue potential received the highest funding. This is because they best reflected the public good nature familiar with Octant funded projects and mission-driven work.
-
Short time-to-impact projects received nearly the same amount of funding. Those with revenue potential received $32,630.67 while those with no revenue potential received $32,632.05, a funding difference of ~$2. In short-term projects, execution only mattered. The near-identical funding suggests that donors cared most about quick, measurable outcomes, and saw both revenue and non-revenue projects as equally worthy as long as they delivered.
-
Long time-to-impact projects with revenue potential received the lowest funding. Despite having the highest number of projects in the round (7), this category received an average of only $15,061.90—$17,000 less than the next highest-funded category. Voters likely saw them as too uncertain, too commercial, or too far from delivering real public benefit and they funded accordingly.
-
The first three quadrants got funding between $32,000–$35,000. Octant donors rewarded projects that were either impactful now or deeply regenerative later, and were open to revenue as long as it didn’t conflict with impact. These three groups succeeded because they struck the right balance between action, credibility, and values alignment.
Patterns based on time
The following analysis explains the results according to the time-to-impact classification.
Funding split by time
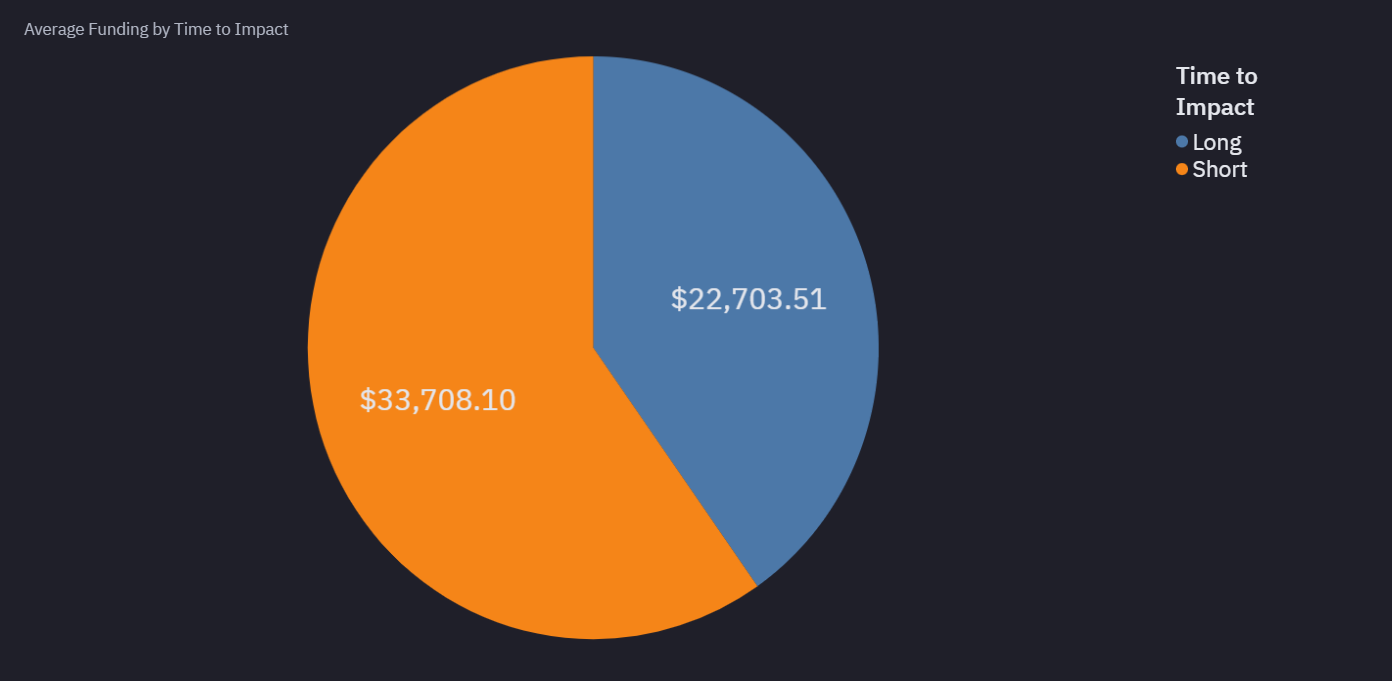
Figure 3.1 - Funding Split by Time
Short time-to-impact projects received $32,631.21, significantly more than long time-to-impact projects, which averaged $23,421.44, a difference of over $9,000. This suggests that donors were more drawn to projects more likely to create visible results within the scope of a single funding cycle. In contrast, longer time-to-impact projects, despite potentially offering more foundational outcomes, likely faced greater scepticism on how soon real-world benefits would be visible.
Funding split by time and category
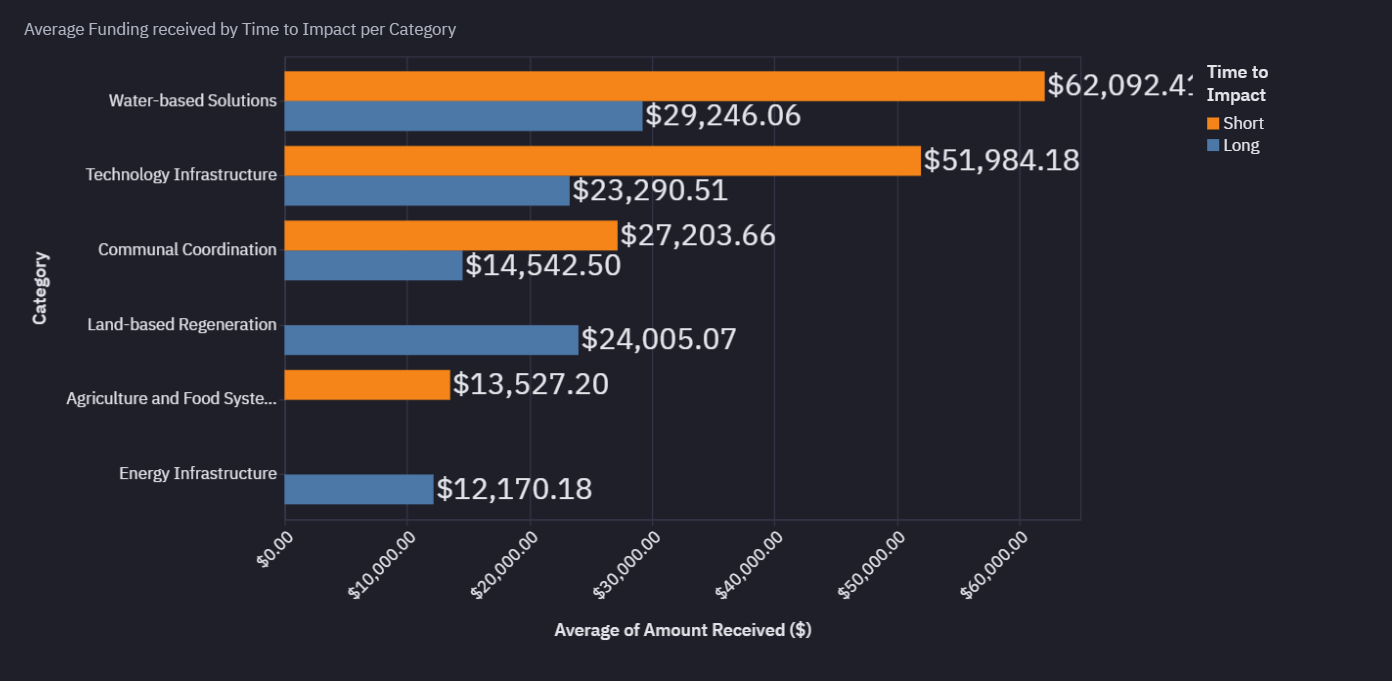
Figure 3.2 - Funding Split by Time and Category
From Fig 3.2, we can see that Water-based Solutions received the highest average funding for short time-to-impact, at $62,092.41, while Agriculture and Food Systems received the least with $13,527.50. On the other hand, Water-based Solutions received the highest average funding for long time-to-impact, at $29,246.06, and Energy Infrastructure, which had only one project, received the lowest at $12,170.18. Overall, categories associated with quicker outcomes tended to secure higher average funding.
Funding quadrant by time and scope
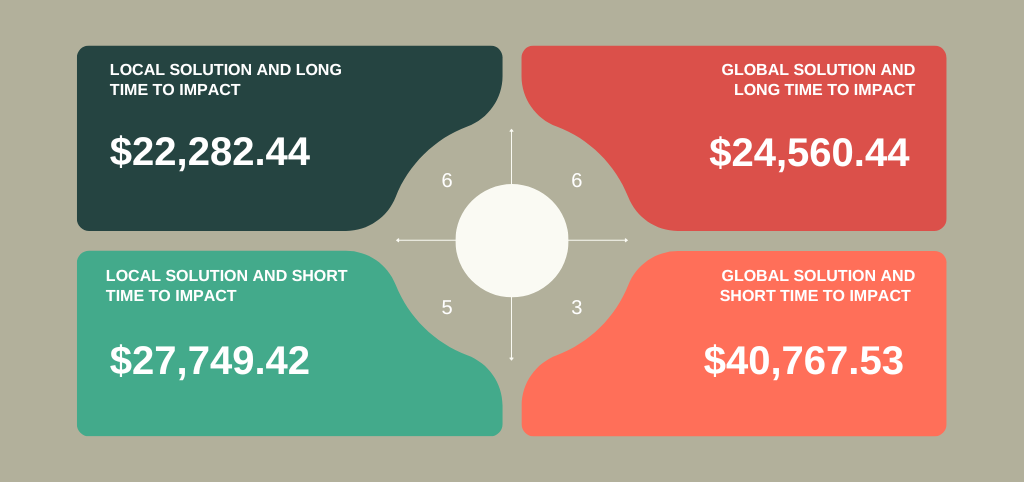
Figure 3.3 - Funding Split by Time and Category
-
Global solutions with short time to impact received the highest funding. With only three projects in the round, this quadrant received an average of $40,767.53—approximately $13,000 more than the second-highest-funded quadrant. This is likely because projects in this quadrant were offering measurable outcomes quickly in multiple regions.
-
Local solutions got mid-tier funding. A likely reason for this could be that local solutions were viewed as having limited scalability and narrow benefits since they focused only on a particular region with no plans to replicate in other regions. Local solutions with short time to impact performed better than the other probably because the speed of outcomes guaranteed help offset their scope limitations.
-
Global solutions with a long time to impact performed poorly compared to those with a short time to impact. This may be because they lacked clear short-term benchmarks to show progress as well as accompanied impact, which made them harder to evaluate or trust than those with a short time to impact.
Funding quadrant by time and Web3
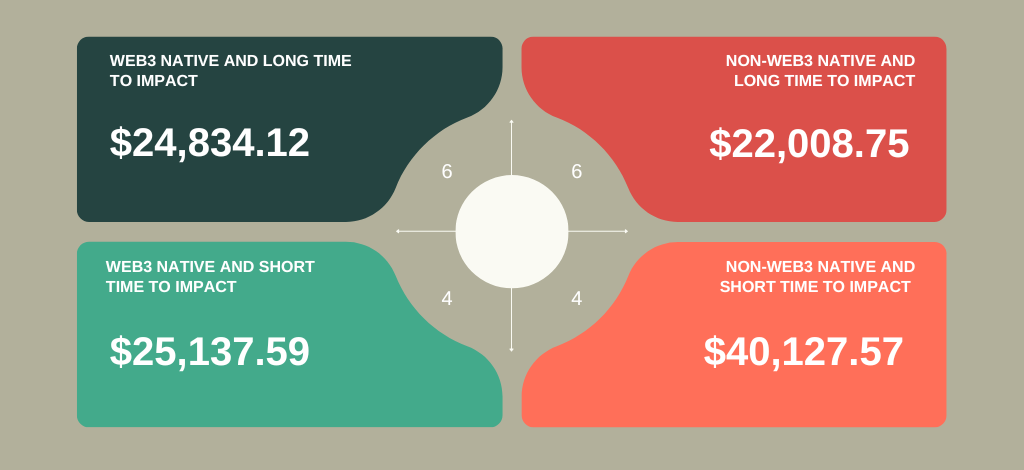
Figure 3.4 - Funding Split by Time and Web3
-
Non web3 native projects with short time to impact received the highest funding. Despite having only four projects in the round, this quadrant received an average of $40,127.57—approximately $15,000 more than the second-highest-funded quadrant. This is likely because these projects appeared more stable, transparent, and easier to evaluate, offering measurable outcomes within a short timeframe.
-
The first three quadrants got funding between $22,000–$25,000. Web3 native projects with a short time to impact, Web3 native projects with a long time to impact, and Non-Web3 native projects with a long time to impact all received average funding between $22,000 and $25,000. Web3 projects likely faced doubts due to the track record of web3 sustainability ventures. Projects with a long time to impact likely faced limited enthusiasm because measurable results may not be available shortly. Projects in these categories likely showed a solid value proposition but faced scepticism due to the above reasons which led to them landing in a funding range that reflects cautious optimism.
Conclusion
Epoch 7 was a major milestone for Octant and climate funding in the crypto space with over $500,000 distributed to green projects around the world. My key takeaway here would be that the themed model works. When focused on a clear field like climate, it can mobilise large amounts of funding, providing enough runway for projects participating to either develop an MVP or become revenue-generating. Looking ahead, Epoch 8 will return to the usual format. Most of the findings from this round may likely be applied after the launch of Octant V2.
I will be watching how the 20 funded projects perform over the next year, and I advise you to do so too. Will they hit their goals with Octant’s support? I’m also curious to see if Octant applies this themed approach to other non-web3 specific areas like public health or education, and whether other web3 projects start to adopt a similar model. If even a few of these projects succeed, Epoch 7 could be remembered as a breakthrough moment for using crypto to fund real climate action.
This article represents the opinion of the author(s) and does not necessarily reflect the editorial stance of CARBON Copy.